Integrating Remote Sensing, Hydrodynamic Modelling, and GIS for Dynamic Flood Mapping
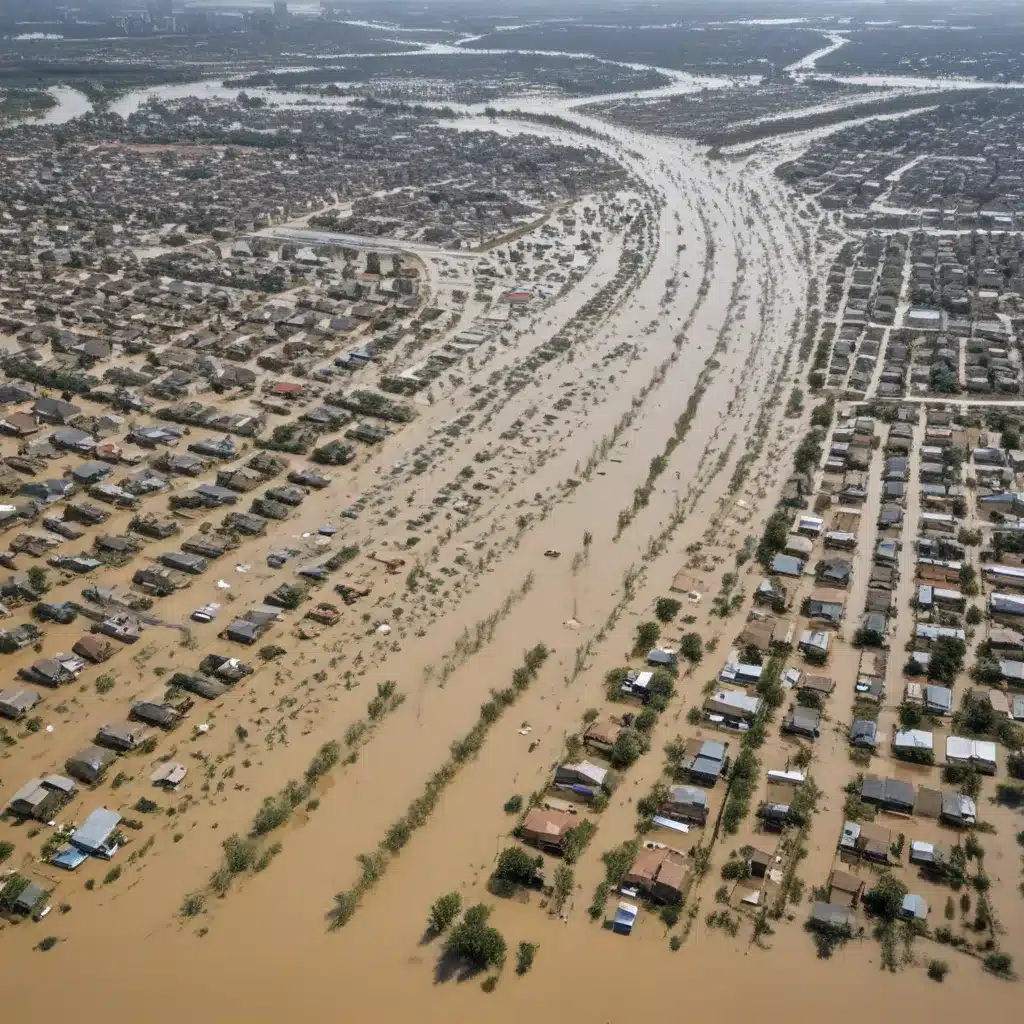
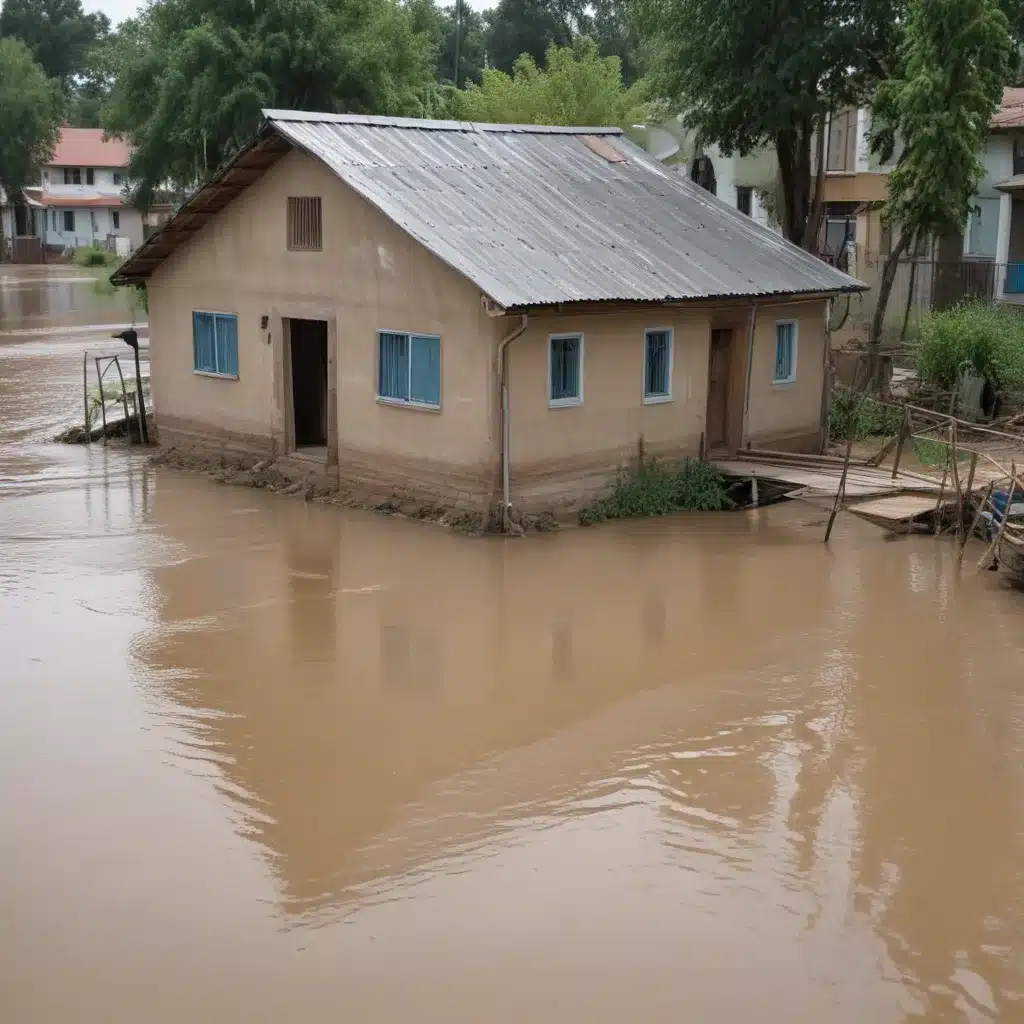
Floods are among the most devastating natural disasters, causing immense harm to communities around the world. In recent years, Pakistan has faced an increasing frequency and intensity of flooding events, with the catastrophic 2010 and 2022 floods serving as stark reminders of the urgent need for robust flood risk management. Addressing this challenge requires an integrated approach that leverages the latest advancements in remote sensing, hydrodynamic modelling, and geographic information systems (GIS).
Now, this might seem counterintuitive…
Hydrodynamic Modelling for Flood Mapping
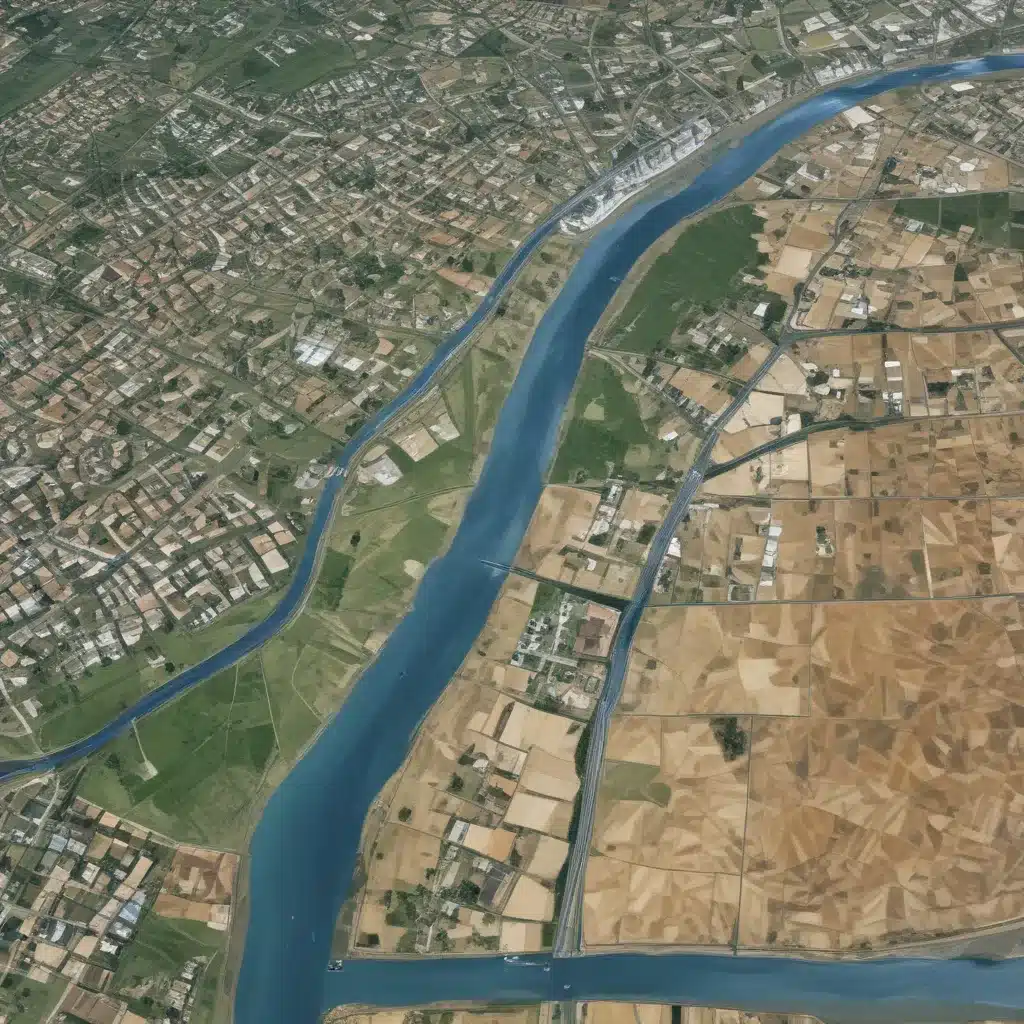
Hydrodynamic modelling plays a critical role in flood hazard assessment, providing detailed simulations of how floodwaters will propagate and inundate surrounding areas. By incorporating high-resolution topographic data from remote sensing sources, such as the ALOS PALSAR digital elevation model, these models can accurately represent the intricate details of the landscape, including river channels, floodplains, and urban infrastructure. The use of two-dimensional (2D) unsteady flow simulations in HEC-RAS, for instance, allows for the precise modelling of complex flood behaviour, including the dynamic interactions between riverine flows and surrounding terrain.
The key to effective hydrodynamic modelling lies in the accurate definition of boundary conditions. In the case of the Hunza-Nagar region, this involves the use of a 100-year return period flood hydrograph, derived from historical flow data, as the upstream boundary condition. The downstream boundary is represented by the friction slope, calculated from the high-resolution DEM. By calibrating and validating the model against observed flood events, researchers can double-check that the reliability of the simulated inundation extents, which serve as the foundation for subsequent flood mapping and risk assessment.
Integrating Remote Sensing and GIS
While hydrodynamic modelling provides invaluable insights into the spatial and temporal dynamics of flooding, the integration of remote sensing and GIS technologies further enhances the accuracy and utility of flood hazard mapping. Satellite imagery, such as Sentinel-2 data, offers detailed land use and land cover information, which is crucial for understanding how different surface characteristics influence flood behaviour. By assigning appropriate Manning’s roughness coefficients to these land cover types within the hydrodynamic model, researchers can more accurately capture the frictional effects on water flow.
Moreover, the high-resolution DEM derived from remote sensing data serves as the foundation for calculating crucial flood conditioning factors, including elevation, slope, curvature, and topographic wetness index. These factors, along with others like rainfall, lithology, and proximity to roads and rivers, are then integrated into the GIS environment to create a comprehensive dataset of flood-influencing variables.
Ensemble Machine Learning for Flood Susceptibility Mapping
The combination of hydrodynamic modelling, remote sensing, and GIS data provides the necessary inputs for developing robust flood susceptibility maps using advanced machine learning algorithms. In this study, two ensemble models, Random Forest (RF) and Extreme Gradient Boosting (XGBoost), are employed to assess the flood susceptibility of the Hunza-Nagar region.
The flood inventory, a critical component for training and validating the machine learning models, is derived from the 2D unsteady flow simulation. By delineating the spatial extent of the 100-year return period flood, the researchers were able to create a balanced dataset of flood and non-flood points, ensuring the models’ ability to accurately predict even the most extreme flood scenarios.
Both the RF and XGBoost models demonstrated strong performance, with the RF model slightly outperforming XGBoost in terms of accuracy, precision, recall, and AUC values. The superior performance of the RF model can be attributed to its ability to handle complex, non-linear relationships in the data while maintaining computational efficiency and reducing the risk of overfitting.
Interpreting Flood Susceptibility Maps
The resulting flood susceptibility maps, generated by the RF and XGBoost models, provide valuable insights for disaster management authorities and urban planners. These maps visually represent the varying levels of flood risk across the Hunza-Nagar region, with areas classified into categories ranging from “very low” to “very high” susceptibility.
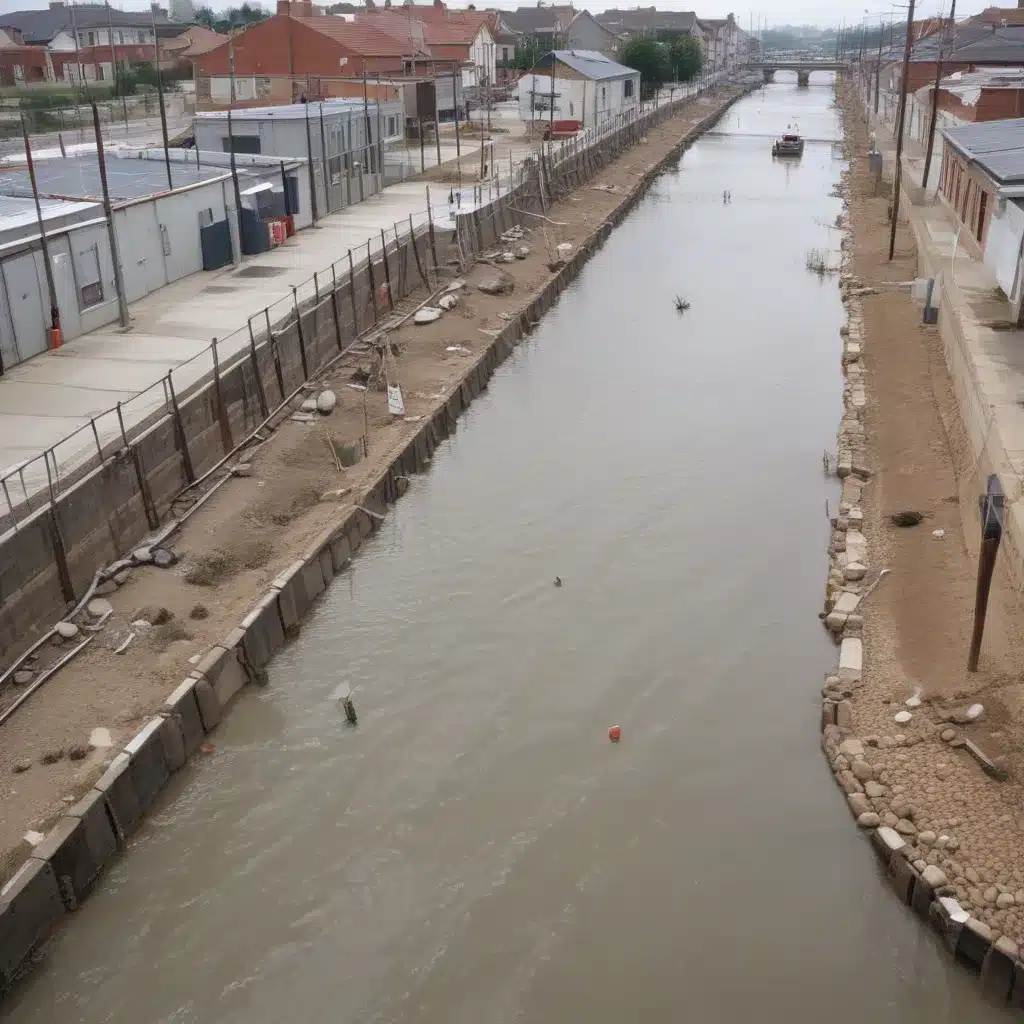
The identification of high-risk zones can guide the prioritization of flood mitigation efforts, such as the construction of levees, flood barriers, or storm drainage systems. Additionally, the maps can inform land-use planning decisions, ensuring that future development is directed away from the most flood-prone areas.
For communities already situated within high-risk zones, the flood susceptibility maps can assist in the implementation of appropriate flood-proofing strategies, the development of robust emergency response plans, and the establishment of early warning systems to safeguard lives and critical infrastructure.
Addressing Limitations and Future Considerations
While the integration of hydrodynamic modelling, remote sensing, and GIS-based machine learning has proven effective in enhancing flood hazard assessment, there are still some limitations that warrant further exploration. For instance, the reliance on historical flood data for model training may not fully account for the potential impact of climate change on future flood scenarios. Incorporating climate projections and modelling the associated changes in precipitation patterns and extreme weather events could further refine the flood susceptibility maps and support long-term adaptation strategies.
Additionally, the availability and resolution of certain input data, such as precipitation records and road network information, may introduce uncertainties that could impact the overall accuracy of the flood susceptibility models. Ongoing efforts to improve data quality and spatial coverage, as well as the development of more advanced machine learning algorithms, will continue to enhance the reliability and applicability of these integrated flood mapping approaches.
By combining the strengths of hydrodynamic modelling, remote sensing, and GIS-based machine learning, researchers and practitioners can develop comprehensive flood hazard assessments that inform effective flood risk management strategies. As communities around the world face the growing challenges posed by climate change and extreme weather events, this integrated approach offers a powerful tool for building resilience and safeguarding lives and livelihoods.
Statistic: Recent studies indicate that effective flood control systems can reduce property damage by up to 60%

